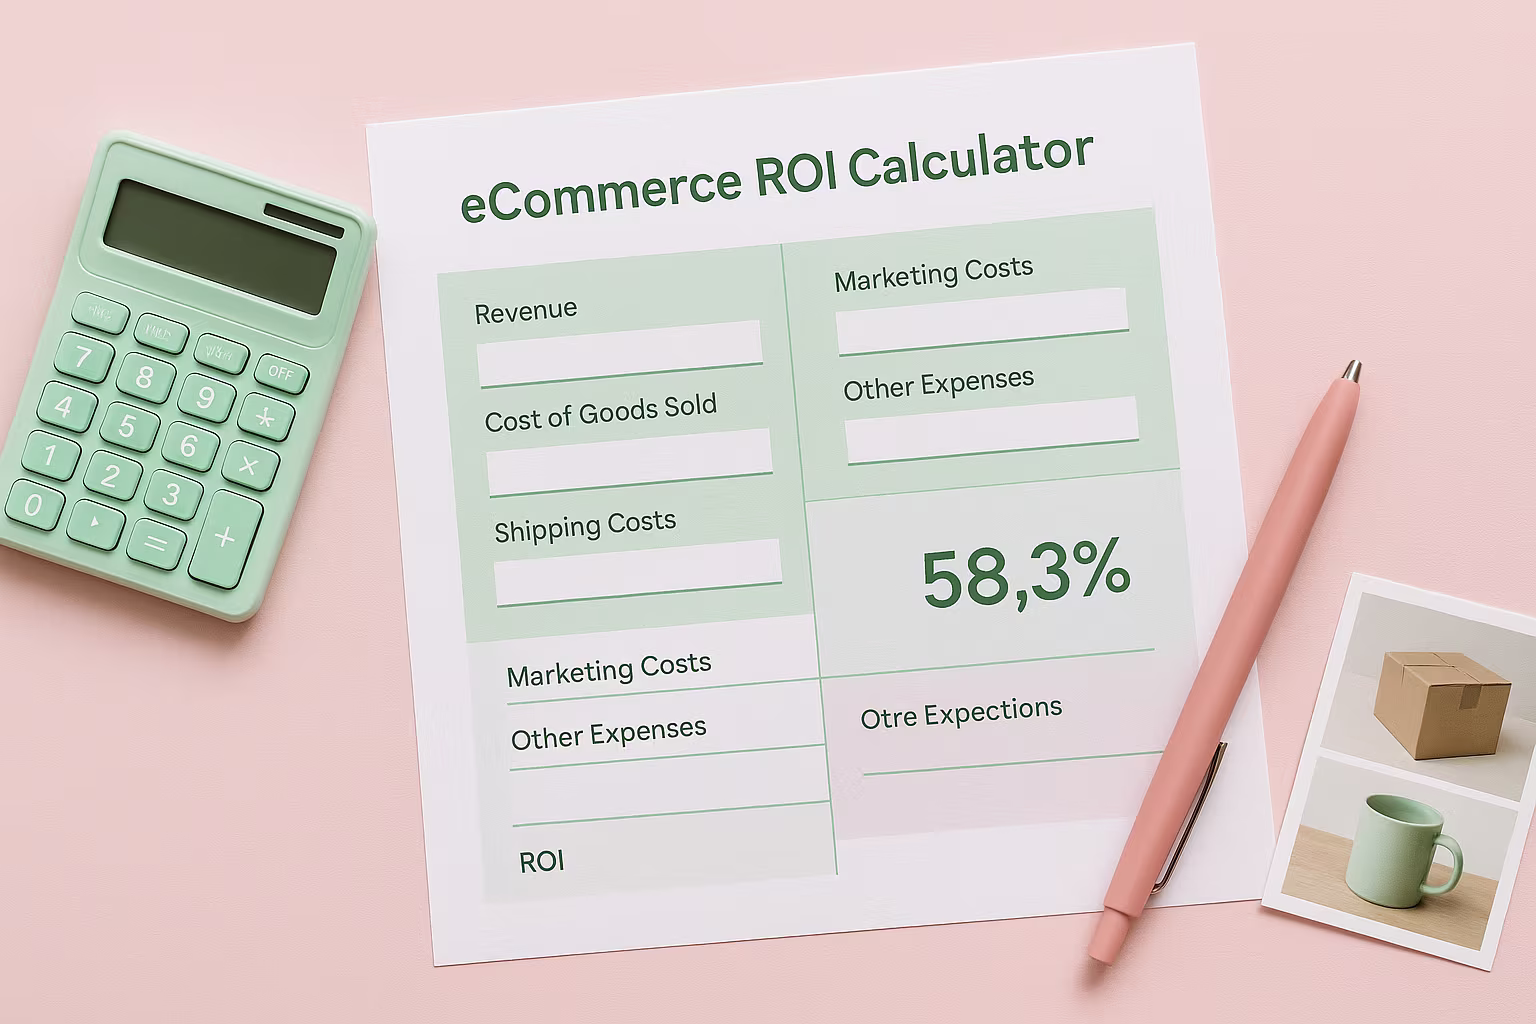
SKU Rationalization Score Tool: Cut Waste, Improve Margins, and Scale the Right Products
Not every product in your catalog deserves equal attention. Some SKUs drain your ad budget while delivering minimal returns, while others consistently drive profit and customer loyalty.
Most supplement and wellness entrepreneurs make gut-feel decisions based on incomplete data, leading to bloated catalogs that waste time and marketing spend.
This SKU Rationalization Score tool gives dropshipping brands a data-driven score that tells you exactly which products to keep, optimize, or drop.
Key Reasons Why You Need the Tool for SKU Rationalization Score
SKU rationalization is systematically evaluating every product you sell to determine if it's profitable or sabotaging your bottom line. For private label supplement businesses, this matters because products have varying repeat purchase rates, margins, and acquisition costs.
Without regular rationalization, here's what happens:
- Ad spend gets diluted across products that'll never break even
- Capital gets trapped in low-margin SKUs instead of high-performers
- Customer experience suffers from cluttered catalogs with mediocre products
- Teams waste time on fulfillment and support for unprofitable items
When you analyze 20 supplement SKUs, you'll typically find 5 products generating 80% of profit, 10 barely covering ad costs, and 5 actively losing money. This tool helps you identify which is which so you can double down on winners and cut anchors.
With a dropshipping model, you can test aggressively and cut quickly without excess inventory penalties, making rationalization even more powerful.
How the SKU Rationalization Score Calculator Works: Your 5-Minute Product Audit
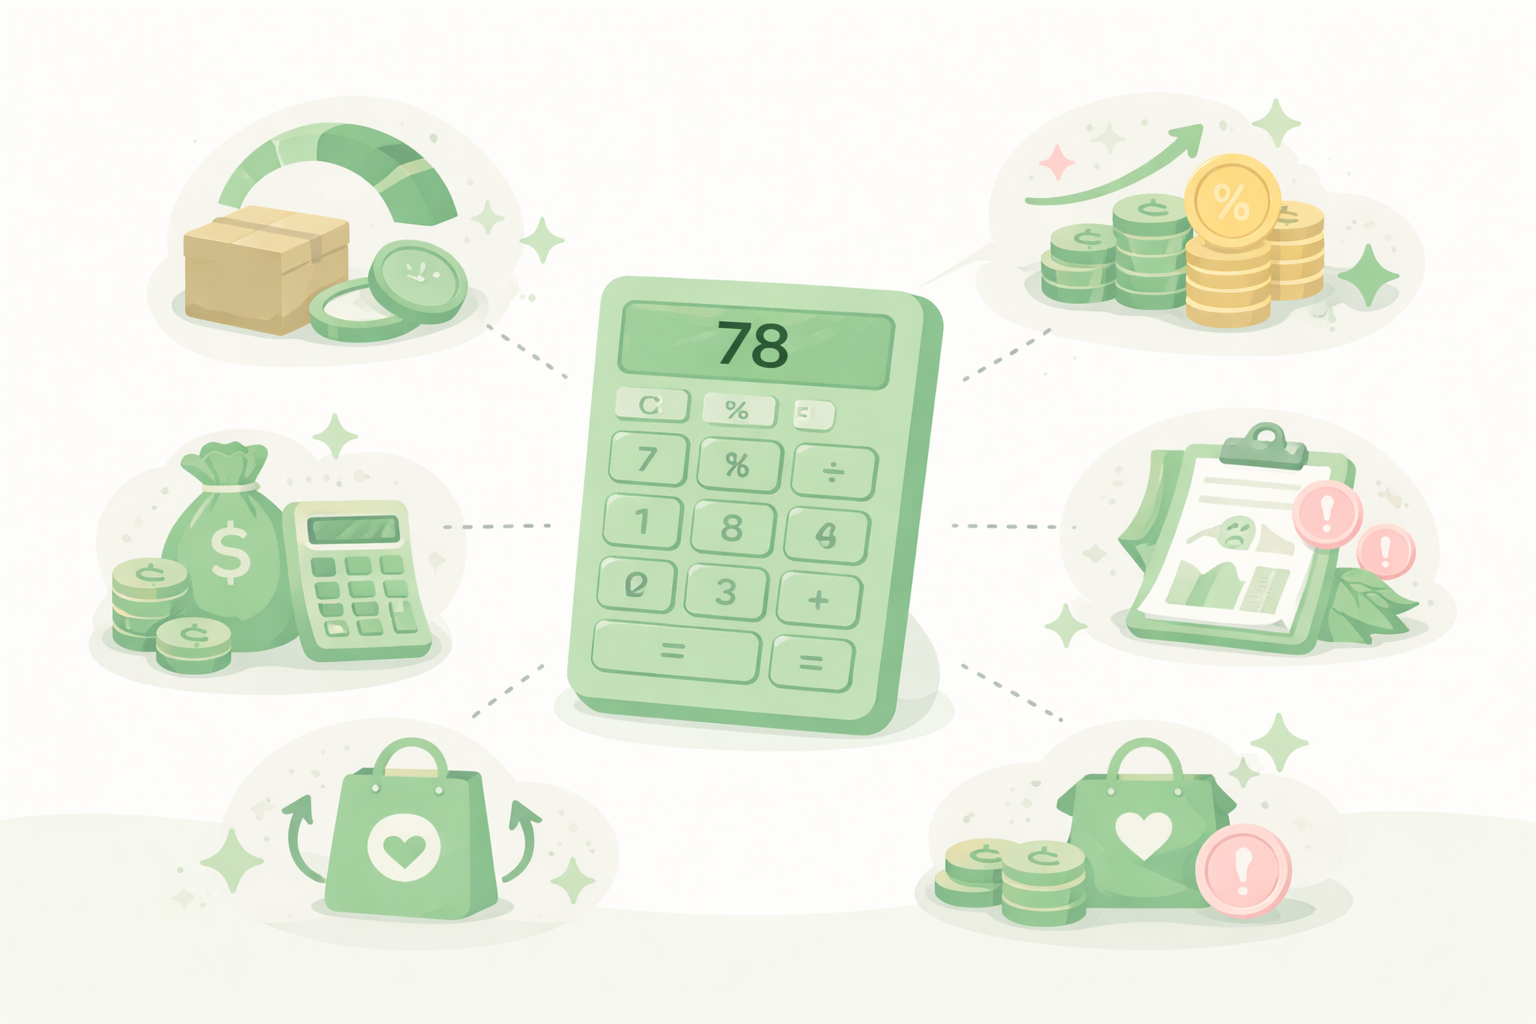
The tool requires five inputs that capture what matters for supplement performance:
1. Monthly Sales Velocity
How many units move per month? This reveals genuine market demand. Products selling 100+ units monthly have fundamentally different economics than those struggling to hit double digits.
For fitness supplements, low velocity often signals weak product-market fit that marketing can't fix.
2. Gross Margin Percentage
Your selling price minus product cost. Healthy margins (40-70%) determine how much room you have for customer acquisition. A skincare product with 60% margins can afford aggressive testing versus a 30% margin item barely covering ad spend.
3. Ad Efficiency (ACoS)
Your Advertising Cost of Sale reveals true profitability. Spending 50% of revenue on ads for one-time purchases isn't sustainable. Smart brands using TikTok Shop target 20-35% ACoS, knowing repeat purchases will improve blended CAC over time.
4. Refund & Return Rate
High refunds destroy supplement brands. Rates above 10% signal product quality issues, overselling benefits, or wrong customer targeting. These damage reputation and increase customer support costs dramatically.
5. Repeat Purchase Potential
This differentiates winners from losers. A digestive health supplement reordered monthly has 5-10x better economics than seasonal one-time purchases. High repeat potential creates subscription revenue opportunities.
Scoring Breakdown:
- Sales velocity: 30% (momentum matters most)
- Gross margin: 25% (determines scalability)
- Ad efficiency: 20% (validates sustainability)
- Refund rates: 15% (protects reputation)
- Repeat potential: 10% (compound value)
You'll get a 0-100 score with clear recommendations and specific next steps.
Reading Your Results: What Your Score Means
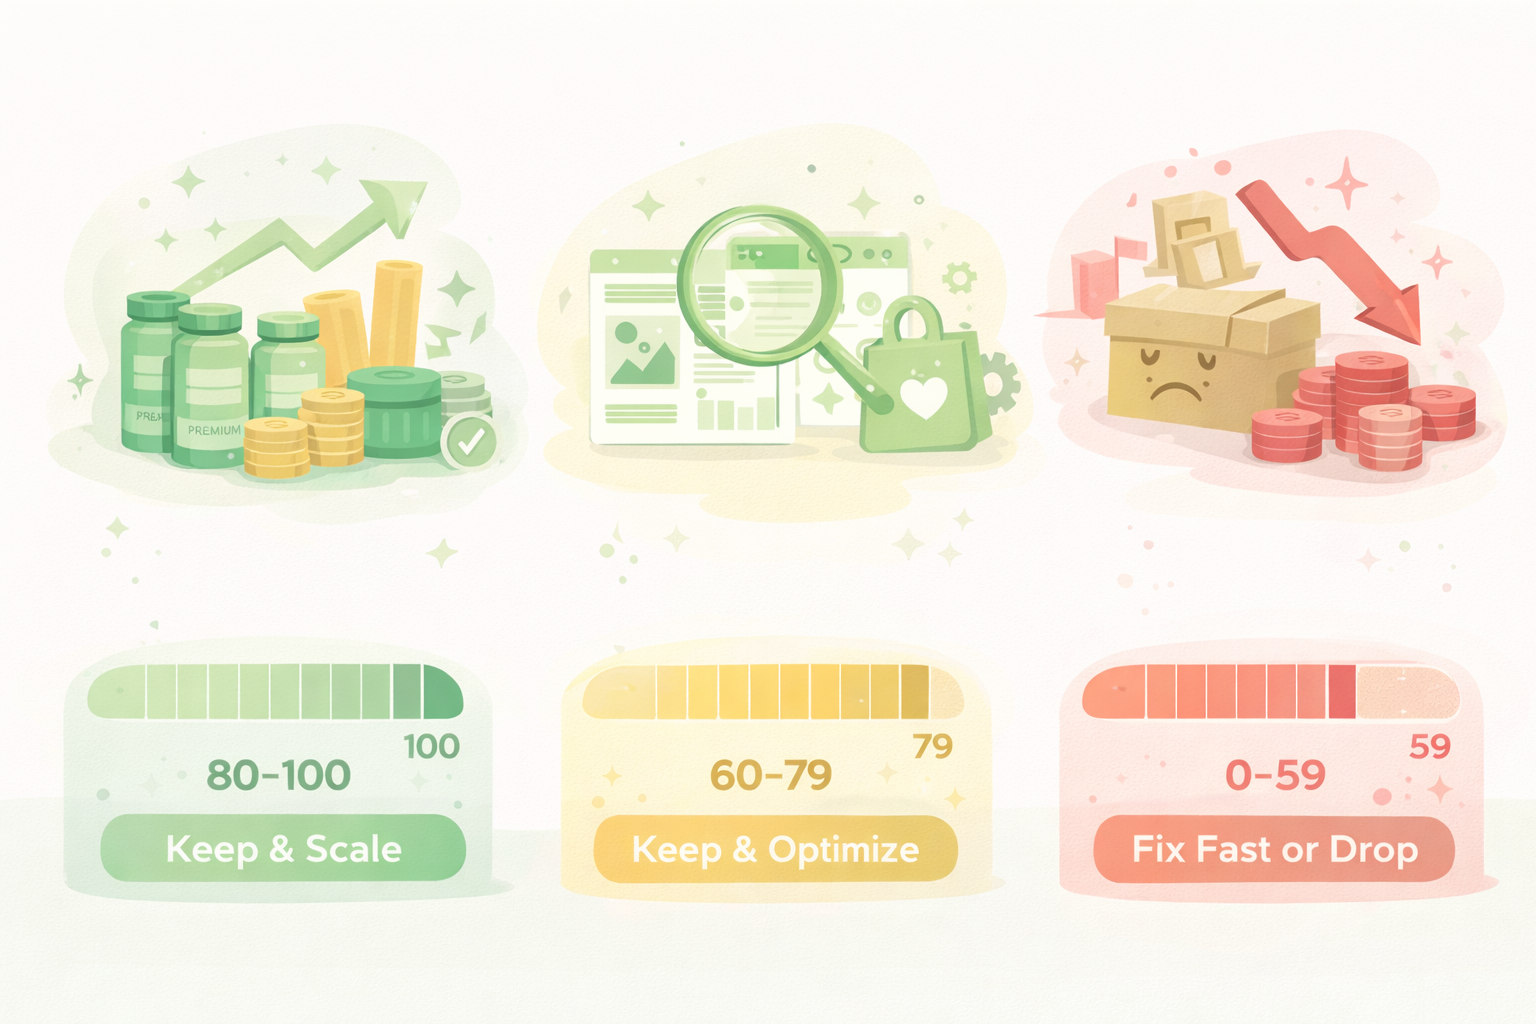
Your score reveals exactly what action to take. Here's how to interpret each range and implement the right strategy immediately.
Score 80-100: Keep & Scale
Your winners deserve maximum investment. Strong velocity, healthy margins, efficient ads, low refunds, and solid repeat purchases are working together.
Immediate actions:
- Increase ad budget 20-30% to capture more demand while the economics are favorable
- Test 5-10% price increases to improve margins without killing conversion
- Create product bundles pairing this SKU with complementary items
- Build subscription offers; these products have loyalty for recurring revenue
Give this priority in your store design, email campaigns, and creative resources.
Score 60-79: Keep & Optimize
Profitable products with improvement potential. A few targeted optimizations can push them into the top tier.
Focus here:
- Run A/B tests on images, descriptions, and landing pages for better conversion
- Refine ad targeting to find customer segments with the best unit economics
- Review pricing against competitors; you might be leaving money on the table
- Analyze where customers drop off in the journey and fix those friction points
Score 40-59: Fix Fast (2-Week Sprint)
Yellow flag territory. Potential exists, but significant issues need rapid resolution.
Your 14-day sprint:
- Test bold changes to pricing, creative, and offer structure; don't be incremental
- Try bundle strategies or upsells to improve economics
- Question whether this product fits your brand direction anymore
- Set clear success metrics and commit to pausing if you don't see improvement
Avoid sunk cost fallacy; every day running unprofitable SKUs wastes resources you could invest in winners.
Score 0-39: Drop or Replace
These products actively hurt your business. They consume resources, inflate your catalog, and dilute brand equity.
Take immediate action:
- Pause all ad spend to stop the bleeding immediately
- Research better-fit alternatives that align with market trends
- Reallocate resources to proven performers with reliable returns
- Learn what went wrong to avoid repeating mistakes on future launches
With a dropshipping model, you're not stuck with inventory; make clean exits and test new products without penalty.
Build a Winning Product Portfolio

Using this tool once won't transform your business. The power comes from monthly or quarterly reviews where you systematically evaluate every product and make disciplined decisions.
Key principles for top-performing wellness brands:
- Test aggressively, cut quickly. Give new products 60 days with proper marketing support, but stick to your benchmarks. If a sleep supplement isn't hitting targets, cut it and move on.
- Track cohort economics over 3-12 months to understand true lifetime value, not just monthly revenue snapshots.
- Consider portfolio balance. Sometimes a mid-tier performer deserves to stay because it complements hero products through cross-sells or attracts different customer segments.
- Scale winners aggressively. When products consistently score 80+, increase ad spend, test new channels, and explore price increases before competitors catch on.
Most successful brands run 15-30 core SKUs, not 100. They dominate with focus rather than spreading thin. When you cut underperformers and invest in winners, you create a cycle: better products → higher satisfaction → more repeats → improved economics → more resources to scale.
Start by evaluating your top 5 revenue products; you might discover bestsellers aren't actually your most profitable when factoring in acquisition costs.
For most dropshipping sellers, this reveals that 20-30% of SKUs should be cut immediately, 40% need optimization, and 30-40% are your scaling foundation.
Build a Lean, Scalable Product Portfolio That Compounds Growth
Real growth doesn’t come from adding more products; it comes from focusing on the ones that truly perform. By consistently evaluating demand, margins, acquisition efficiency, refunds, and repeat behavior, you create a clear system for smarter decisions.
Cutting low-impact products frees up budget, attention, and creative energy to scale what actually works. Over time, this discipline leads to stronger economics, better customer experiences, and predictable growth.
Review your catalog regularly, act on the data without hesitation, and let focus and execution, not product volume, drive long-term success.
FAQ


Related blogs
.avif)
Contribution Margin Calculator: Measure What Each Sale Contributes to Profit
Chargeback ROI Calculator: Predict Your Savings and ROI in Under 10 Seconds
Break-Even ROAS Calculator: Find Out What You Can Afford to Spend on Ads