How to Calculate Average Order Size in E-commerce Business? Simple Guide
About Supliful
In e-commerce, boosting revenue doesn’t always mean gaining more customers; it often starts with optimizing the value of each sale.
Increasing your average order value (AOV) by just 10% can lead to substantial profit gains without raising acquisition costs.
Understanding how to calculate average order size in an e-commerce business is essential for shaping smart pricing strategies, tailoring promotions, and making informed product decisions that strengthen your bottom line.
Calculation Guide for Average Order Size in E-commerce
Average order value (AOV) represents the average amount spent each time a customer places an order on your website or marketplace..
The formula for calculating average order value is straightforward:
Average Order Value = Total Revenue ÷ Number of Orders
For example, if your store generated $10,000 in revenue from 200 orders during a specific period, your AOV would be:
$10,000 ÷ 200 = $50
This calculation tells you that customers spend an average of $50 per transaction.
When and How Often to Track AOV
For meaningful analysis, calculate AOV across different timeframes:
- Daily tracking helps identify the immediate impacts of promotions or website changes
- Weekly tracking smooths out daily fluctuations for more reliable short-term trends
- Monthly tracking provides a solid baseline for performance assessment
- Quarterly and annual tracking reveals long-term patterns and seasonal variations
Most e-commerce platforms like Shopify and WooCommerce include AOV in their analytics dashboards, but you can also track it manually using spreadsheets or integrate with more robust analytics tools for deeper insights.
AOV is more than just a metric; it’s your business pulse. When paired with other key figures like CAC and margin, it shows whether you’re building a profitable engine or bleeding from the back end.
Use this breakdown to understand what each number reveals and how to use it.
Why Average Order Value Matters for E-commerce Success

Understanding your AOV isn't just about collecting data; it's about leveraging that information to drive strategic business decisions. Here's why AOV deserves your attention:
Profitability Impact
Increasing AOV directly boosts revenue without necessarily increasing customer acquisition costs. This makes it one of the most cost-effective ways to improve profitability.
When you can extract more value from existing traffic, your return on advertising spend (ROAS) improves dramatically.
Customer Acquisition Context
When viewed alongside your customer acquisition cost (CAC), AOV helps determine the efficiency of your marketing spend. For sustainable growth, your AOV should significantly exceed your CAC.
Benchmarking Performance
Comparing your AOV against industry standards helps gauge your competitive position. While average order values vary widely by industry, from $50-80 for general merchandise to $100-250 for specialty products and $300+ for luxury goods, knowing where you stand provides valuable context.
Product Strategy Insights
AOV trends can inform product development and inventory decisions by revealing which products and combinations drive higher transaction values.
Strategies to Increase Your Average Order Value
Implementing targeted strategies to boost AOV can significantly impact your bottom line without requiring additional marketing spend.
Here are proven tactics to increase how much customers spend per order:
Product Bundling and Packages
Create thoughtfully curated product bundles that offer complementary items at a slight discount compared to buying each product individually. This approach encourages customers to purchase more items while still perceiving added value.
Pro tip: Test different bundle combinations based on purchase history data to identify the most compelling product pairings that customers might not discover on their own.
Upselling and Cross-selling Techniques
Strategically recommend premium versions of products (upselling) or complementary items (cross-selling) throughout the shopping experience:
- During product browsing with "you might also like" suggestions
- On product pages showing "frequently bought together" items
- At checkout, with "complete your purchase" recommendations
For cross-selling to be effective, ensure recommended products genuinely enhance the primary purchase rather than appearing as random suggestions.
Free Shipping Thresholds
One of the most effective AOV-boosting strategies is implementing free shipping thresholds slightly above your current AOV.
For example, if your AOV is $45, offering free shipping on orders over $60 creates a powerful incentive for customers to add more items to their cart.
Display messaging throughout the shopping experience, showing how much more customers need to spend to qualify for free shipping. This creates a psychological incentive to reach that threshold rather than pay for shipping.
Loyalty Programs and Rewards
Implement tiered reward systems that incentivize larger purchases. For instance, offer:
- Points that scale with purchase value
- Exclusive benefits at certain spending thresholds
- Rewards that can be redeemed on future purchases
Loyalty programs not only boost AOV but also improve customer lifetime value by encouraging repeat purchases.
Volume Discounts and Tiered Pricing
Encourage bulk purchases by offering incremental discounts based on quantity. This works particularly well for consumable products where customers understand the long-term value of stocking up.
For example:
- Buy 1 for $30 each
- Buy 2 for $25 each
- Buy 3+ for $20 each
This strategy works especially well for private label products where you have greater pricing flexibility.
Limited-Time Offers and Urgency
Create time-sensitive promotions that encourage customers to maximize their order value within a limited window. Examples include:
- 24-hour flash sales with scaled discounts (spend $100, save 10%; spend $200, save 20%)
- Countdown timers showing when special offers expire
- Limited-quantity promotions that create scarcity
These tactics leverage psychological triggers like FOMO (fear of missing out) to drive immediate purchasing decisions.
Analyzing AOV Data for Strategic Insights

Raw AOV numbers provide a starting point, but deeper analysis reveals more actionable insights:
Segmentation by Customer Type
Break down AOV by customer segments to understand spending patterns:
- New vs. returning customers
- Demographic groups
- Traffic sources
- Device types (mobile vs. desktop)
This segmentation often reveals that certain customer groups have significantly higher AOV, allowing you to adjust marketing strategies accordingly.
Product-Based AOV Analysis
Calculate AOV for different product categories, price points, and seasonal trends. This analysis might reveal that certain product types consistently drive higher order values, suggesting where to focus inventory expansion and marketing efforts.
For businesses offering private label products across multiple categories, this analysis can be particularly valuable for identifying your most profitable product lines.
Marketing Channel Impact
Compare AOV across different marketing channels to optimize your acquisition strategy. Often, certain channels (like email marketing or organic search) deliver higher AOV than others (like social media ads), which should influence your channel allocation strategy.
Common AOV Calculation Mistakes to Avoid
When calculating and analyzing your average order value, watch out for these common pitfalls:
Ignoring Returned Orders and Refunds
Failing to account for returns and refunds in your calculations can artificially inflate your AOV. Always use net revenue (after returns) for accurate measurements.
Not Excluding Outliers
Extremely large or small orders can skew your AOV and lead to misguided strategies. Consider calculating a "trimmed mean" that excludes outlier orders, or analyze the median order value alongside the average order value for more context.
Overlooking Seasonal Variations
Many businesses experience significant AOV fluctuations throughout the year. Comparing current performance to the same period in previous years provides more meaningful insights than month-over-month comparisons alone.
Focusing on AOV in Isolation
While important, AOV should be evaluated alongside other metrics like conversion rate, traffic volume, and repeat purchase rate. Sometimes, a strategy that increases AOV might negatively impact conversion rates, resulting in lower overall revenue.
For example, a store with a 3% conversion rate and $50 AOV might generate more total revenue than one with a 1.5% conversion rate and $80 AOV from the same traffic.
Advanced AOV Optimization Techniques

Once you've implemented basic AOV improvement strategies, consider these more sophisticated approaches:
Dynamic Pricing Algorithms
Implement systems that adjust pricing based on customer behavior, inventory levels, and competitive factors. These algorithms can optimize price points to maximize both conversion rates and order values.
Predictive Product Recommendations
Use machine learning to analyze purchase patterns and recommend products with a higher probability of purchase rather than simply showing related items. Advanced recommendation engines can significantly outperform basic cross-selling.
Post-Purchase Upsells
Extend the opportunity to increase order value even after initial checkout. Offering one-click add-ons immediately after purchase can capture additional revenue while the customer is still in buying mode.
Subscription Models
Convert one-time purchases into recurring revenue by offering subscription options with built-in discounts. This not only increases initial AOV but also secures future revenue.
This approach works particularly well for consumable products like private label coffee or specialty supplements, where regular replenishment provides genuine customer convenience.
Turning AOV Insights into Action
Once you understand your AOV and have implemented strategies to improve it, the next step is creating a systematic approach to ongoing optimization:
- Establish baseline metrics for your current AOV across different segments
- Set realistic improvement targets based on industry benchmarks and historical performance
- Implement one optimization strategy at a time and measure its specific impact
- A/B test variations of successful strategies to further refine results
- Document what works and scale successful approaches across your business
Remember that small AOV improvements compound over time. A 10% increase in AOV combined with steady order volume translates directly to 10% revenue growth without additional marketing spend.
Expert Strategy: Link AOV Growth with Purchase Frequency
Most brands focus on increasing AOV or driving repeat purchases, but rarely optimize both together. Tracking AOV alongside purchase frequency gives a clearer picture of customer lifetime value and reveals opportunities to scale smarter.
For instance, if customers buy every 90 days, offer bundles or subscriptions that boost both value and frequency. Tailor campaigns like timed restock reminders or loyalty rewards for high-value repeat buyers.
When aligned, these two metrics can unlock compounding revenue growth with minimal extra spend.
Maximizing Your E-commerce Growth Through AOV Optimization
Average order value isn't just another metric; it’s a powerful lever for e-commerce growth that’s often overlooked compared to traffic or conversion rate optimization.
By actively calculating, analyzing, and improving your AOV, you can boost profitability without increasing marketing spend.
Start with the core strategies in this guide, then expand into more advanced tactics as you gather insights. The most effective AOV growth comes from understanding your customers and offering real value that encourages larger purchases.
FAQ


Related blogs
.avif)
Contribution Margin Calculator: Measure What Each Sale Contributes to Profit
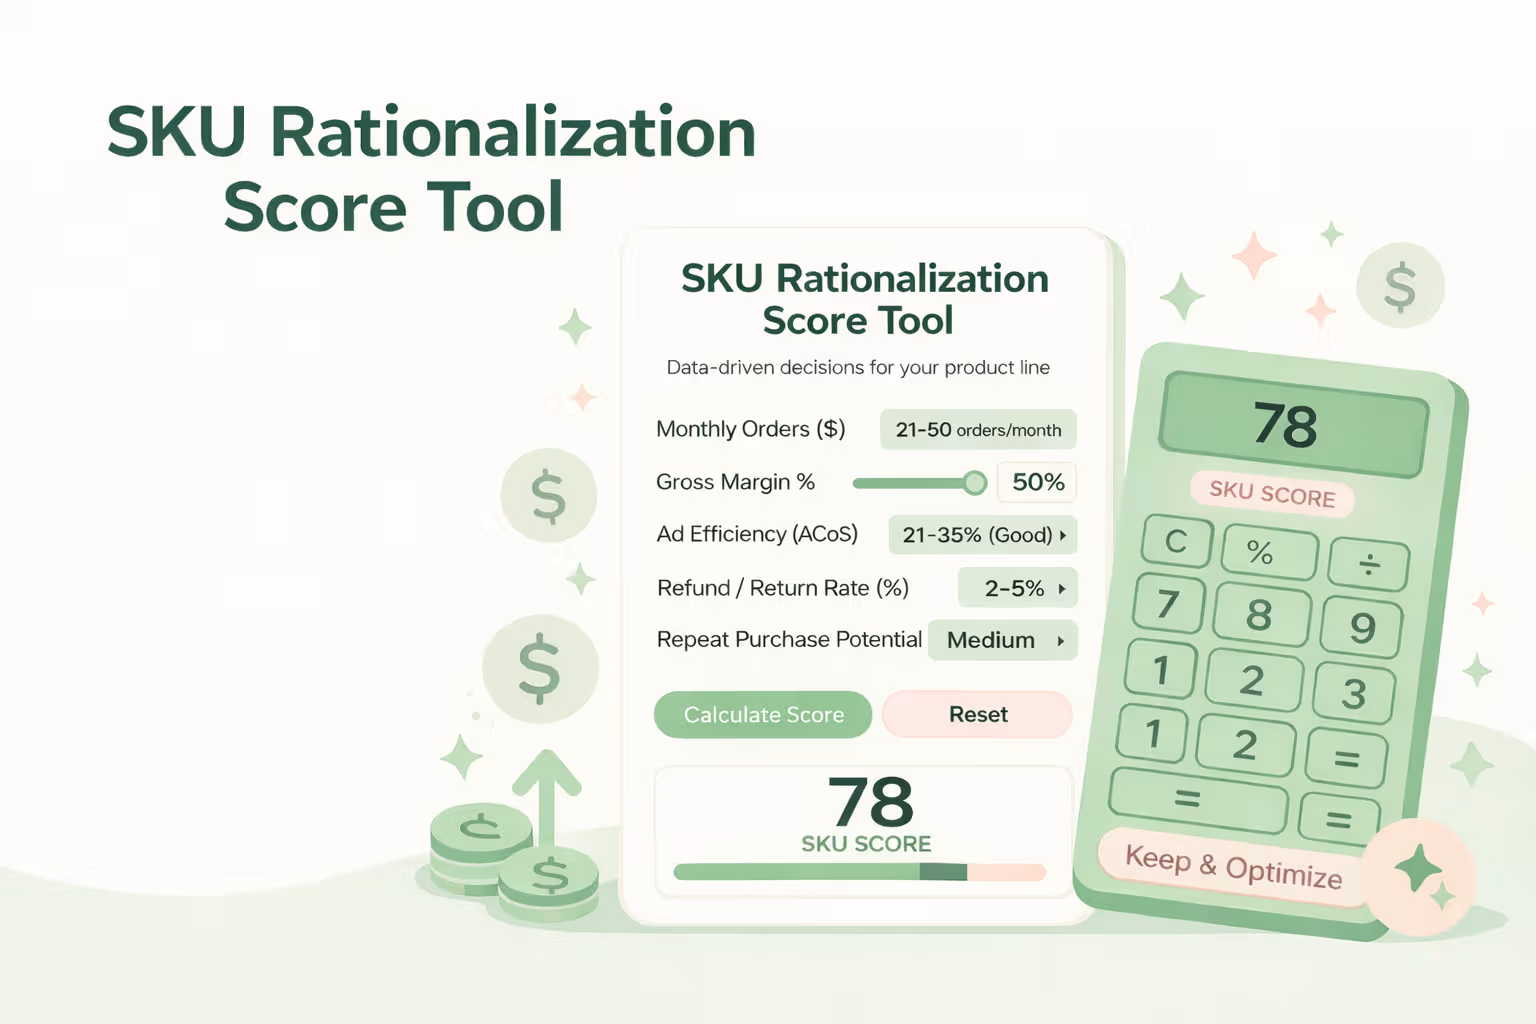
SKU Rationalization Score Tool: Cut Waste, Improve Margins, and Scale the Right Products

Price Elasticity Of Demand Calculator: Predict Revenue Impact in Seconds