Customer Lifetime Value Calculator: Unlock Your E-commerce Revenue Potential
About Supliful
Running a brand without knowing your customer lifetime value is like launching ads with your eyes closed. The Customer LTV Calculator provides instant clarity, enabling you to transition from short-term sales to long-term strategy.
If you’ve ever wondered whether your Meta campaign is profitable or if offering fast customer support and loyalty perks pays off, this tool gives you the answers. It shows the true dollar value each customer brings over time, so you can make smarter decisions around acquisition, retention, and product strategy.
Because serious brands aren’t built on one-time checkouts, they’re built on relationships that keep paying off.
Mastering Every Component of Your Customer Lifetime Value Analysis
Understanding customer lifetime value (CLV) isn’t just about plugging in numbers; it’s about unlocking insights that help you scale smarter and stay profitable.
Here’s a breakdown of each component in the calculator, with real-world examples to show how every input shapes your bottom line.
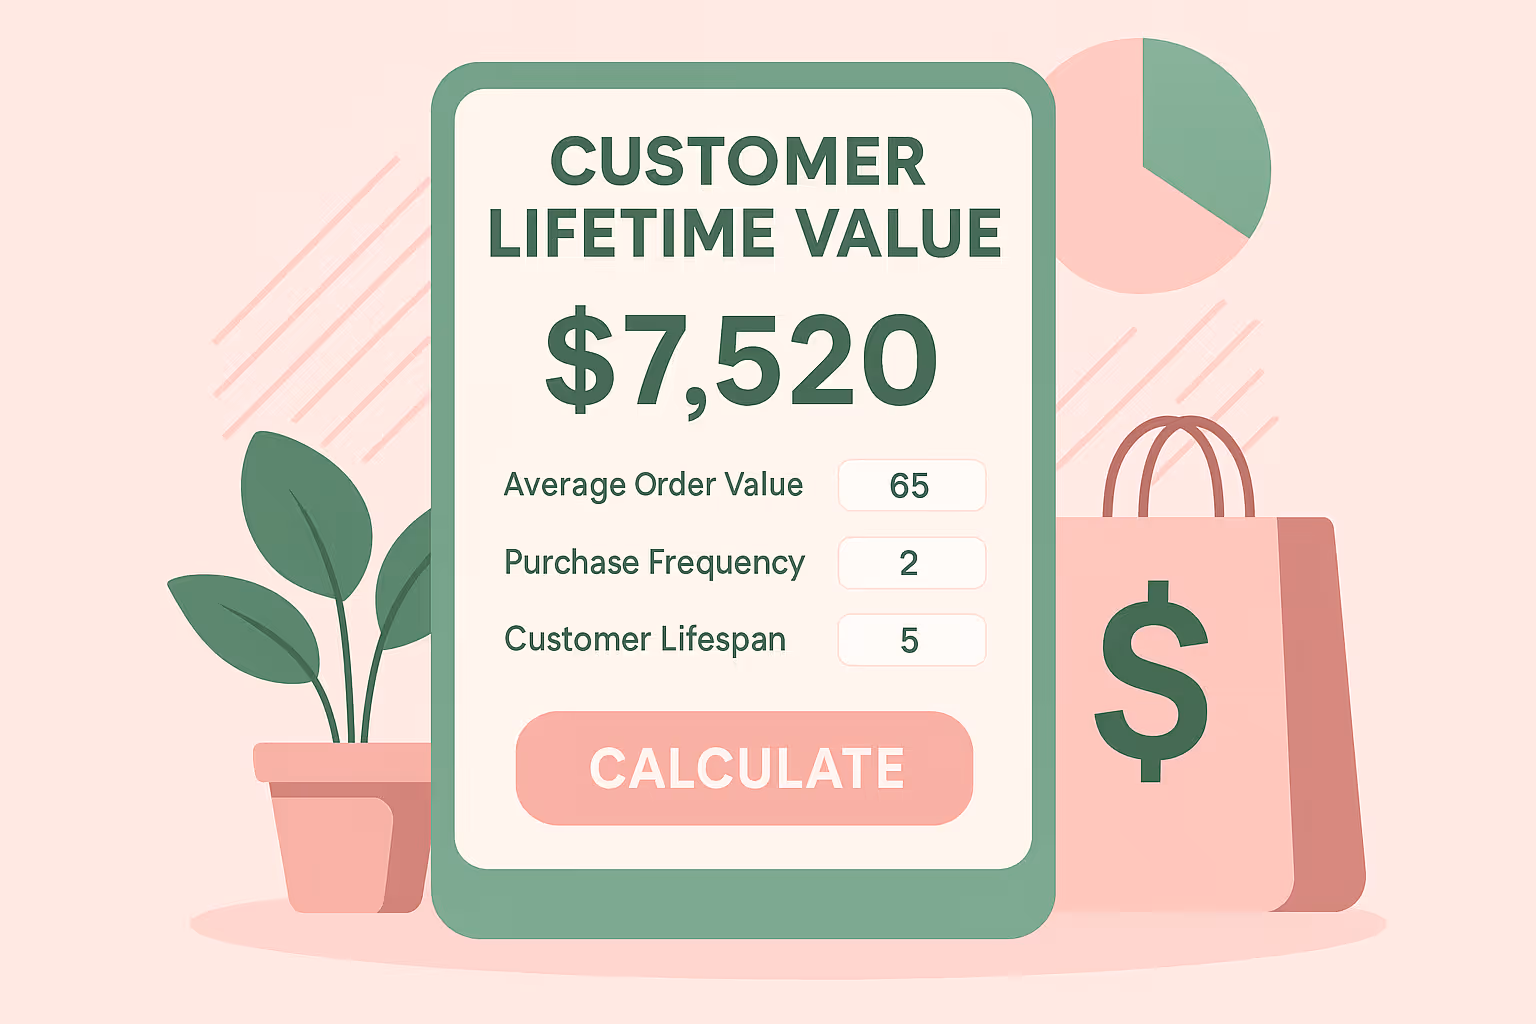
1. Average Order Value: The Foundation of Customer Economics
Average Order Value (AOV) measures the typical amount customers spend per transaction. This baseline metric reveals customer purchasing power and helps identify opportunities for increasing transaction sizes through upselling, bundling, or premium positioning.
This metric captures the typical transaction size across your customer base, serving as the fundamental building block for all CLV calculations and revealing purchasing behavior patterns.
Examples:
- Premium Beauty Brand - AOV: $145 per order. Customers often buy multiple products. Focused on high-end skincare.
- Athletic Wear Retailer - AOV: $89 per order. Sales fluctuate seasonally. Bundles and promotions help boost order size.
- Subscription Coffee Service - AOV: $52 per order. Delivers monthly with little seasonal variation.
Why It Matters: AOV directly multiplies through frequency and duration to determine total customer value. Small AOV improvements compound dramatically across the entire customer base and relationship timeline.
2. Gross Margin Percentage: The Profitability Reality Check
This captures the profit remaining after direct product costs. Unlike revenue-based calculations, this component ensures your CLV reflects actual profitability rather than misleading top-line numbers that ignore cost structures.
Examples:
- Software-as-a-Service Platform - Gross Margin: 78%. Minimal ongoing product costs and high-margin recurring revenue.
- Private Label Electronics - Gross Margin: 42%. Impacted by manufacturing, import fees, and component price fluctuations.
- Dropshipping Operation - Gross Margin: 35%. Driven by wholesale pricing and supplier fee structures.
Why It Matters: Gross margin transforms revenue into actual profit available for business operations, growth investments, and stakeholder returns. Accurate margin calculation prevents overestimating customer value and enables realistic growth planning.
3. Customer Acquisition Cost: The Investment Reality
Customer acquisition cost encompasses all expenses required to convert prospects into paying customers, including marketing spend, sales costs, and onboarding investments that directly impact net customer profitability.
- Direct-to-Consumer Wellness Brand - CAC: $67 per customer. Costs include Facebook/Google ads and influencer partnerships.
- B2B Manufacturing Software - CAC: $340 per customer. Includes sales team commissions, trade shows, and demo-related expenses.
- Local Service Business - CAC: $28 per customer. Driven by referral incentives and local advertising spend.
Why It Matters: CAC directly reduces net CLV and determines the sustainability of growth strategies. Understanding true acquisition costs enables optimal marketing budget allocation and channel prioritization.
4. Average Purchase Frequency: The Retention Indicator
This component measures how often customers return to make additional purchases within a defined timeframe, revealing the strength of customer relationships and effectiveness of retention strategies.
Examples:
- Specialty Food Retailer - Purchase Frequency: 6.2 times annually. Seasonal spikes during holidays, boosted by loyalty programs.
- Professional Services Firm - Purchase Frequency: 2.1 times annually. Project-based model with long-term client retention.
- Fashion Accessories Brand - Purchase Frequency: 4.8 times annually. Driven by trends and supported by effective email marketing.
Why It Matters: Purchase frequency multiplies the value of every other CLV component. Higher frequency indicates stronger customer engagement and provides more opportunities for relationship deepening and value creation.
5. Customer Relationship Duration: The Loyalty Multiplier
This metric represents the average length of customer relationships from initial purchase through final transaction, serving as the ultimate multiplier for all other CLV components.
Examples:
- Subscription Meal Kit Service - Relationship Duration: 18 months average. Seasonal retention issues; onboarding experience heavily influences churn.
- Enterprise Software Provider - Relationship Duration: 4.7 years average. High switching costs and contract renewals drive long-term retention.
- Consumer Electronics Retailer - Relationship Duration: 2.3 years average. Shaped by tech upgrade cycles and cross-selling potential.
Why It Matters: Relationship duration multiplies all other value components, making retention the highest-leverage area for CLV improvement. Small retention improvements generate compound returns across the entire customer portfolio.
6. Return and Refund Rate: The Hidden Profit Killer
This often-overlooked component accounts for the percentage of transactions that result in returns or refunds, significantly impacting true customer profitability through reduced effective revenue and additional processing costs.
Examples:
- Online Fashion Retailer - Return Rate: 18%. High due to sizing issues; free return shipping increases volume.
- Electronics Equipment Seller - Return Rate: 7%. Linked to product defects and technical support requirements.
- Digital Product Marketplace - Return Rate: 3%. Driven by satisfaction guarantees and instant refund policies.
Why It Matters: Returns reduce effective revenue while adding processing costs, creating a double impact on profitability. Understanding and optimizing return rates can significantly improve CLV calculations and actual business performance.
Complete Customer Lifetime Value Analysis Examples
See how CLV varies across different business models with real-world ecommerce and B2B scenarios.
Scenario: Organic Skincare Subscription
Recurring orders and high retention make CLV a key growth metric in subscription skincare.
Input Values
- Average Order Value: $78
- Gross Margin: 68%
- Customer Acquisition Cost: $45
- Purchase Frequency: 8 times annually
- Relationship Duration: 2.2 years
- Return Rate: 6%
Calculation Results
- Total Orders: 17.6 over a lifetime
- Total Revenue: $1,365 (before returns)
- Adjusted Revenue: $1,283 (after 6% returns)
- Gross Profit: $872
- Net CLV: $827 (after CAC)
- CLV to CAC Ratio: 19.4:1
Analysis: Exceptional subscription economics with predictable revenue streams. High margins and strong retention create substantial customer value. Premium positioning supports sustainable growth with significant reinvestment capacity.
Scenario: Mid-Market Manufacturing Equipment
Long sales cycles and high-value deals shape a different CLV profile for B2B equipment brands.
Input Values
- Average Order Value: $2,400
- Gross Margin: 28%
- Customer Acquisition Cost: $380
- Purchase Frequency: 1.8 times annually
- Relationship Duration: 3.5 years
- Return Rate: 4%
Calculation Results
- Total Orders: 6.3 over lifetime
- Total Revenue: $15,120 (before returns)
- Adjusted Revenue: $14,515 (after 4% returns)
- Gross Profit: $4,064
- Net CLV: $3,684 (after CAC)
- CLV to CAC Ratio: 10.7:1
Analysis: Strong B2B customer economics with typical manufacturing margins. Lower frequency is offset by longer relationships and higher-order values. Solid foundation for strategic account management and relationship-deepening initiatives.
Scenario: Fast Fashion E-commerce
Frequent purchases and high return rates create unique CLV dynamics in fast fashion.
Input Values
- Average Order Value: $45
- Gross Margin: 52%
- Customer Acquisition Cost: $32
- Purchase Frequency: 5.5 times annually
- Relationship Duration: 14 months (1.17 years)
- Return Rate: 22%
Calculation Results
- Total Orders: 6.4 over lifetime
- Total Revenue: $288 (before returns)
- Adjusted Revenue: $225 (after 22% returns)
- Gross Profit: $117
- Net CLV: $85 (after CAC)
- CLV to CAC Ratio: 3.7:1
Analysis: Moderate performance typical of fast fashion with high return rates. Acceptable margins but short customer relationships limit value creation. Focus needed on retention improvement and return rate reduction for optimization.
Advanced Strategies for Maximizing Customer Lifetime Value Through Systematic Optimization
Successful e-commerce brands optimize each CLV component to drive long-term, compounding profitability.
Engineering Higher Average Order Values Through Strategic Design
Boosting AOV starts with customer psychology and seamless strategies. Bundling complementary products (e.g., a skincare set) adds value while raising spend.
Setting free shipping thresholds just above your current AOV encourages larger carts. Upsells like premium versions or warranties work best when framed as upgrades, not add-ons.
Optimizing Gross Margins Without Sacrificing Customer Value
Improving margins shouldn’t hurt customer experience. Renegotiating with suppliers, prioritizing high-margin products, and streamlining operations can boost profitability without affecting retention. Even small efficiency gains scale quickly across large order volumes.
Reducing Customer Acquisition Costs Through Channel Optimization
Lower CAC boosts CLV and frees up the budget to scale what works. Analyze channels to focus on those delivering high-value customers. Referral programs often cut CAC in half, while organic strategies like SEO drive long-term growth at lower cost.
Critical Customer Lifetime Value Calculation Mistakes That Distort Business Strategy
Even experienced business owners make costly errors when calculating customer lifetime value. These mistakes can lead to poor pricing decisions, misguided marketing investments, and flawed growth strategies.
Underestimating the True Cost of Customer Acquisition
Many businesses overlook hidden CAC inputs, like sales commissions, onboarding costs, and marketing tool expenses, understating acquisition costs by 30–50%. A complete CAC calculation should reflect all efforts required to convert and onboard a customer.
Ignoring Return Processing Costs That Erode Margins
Returns reduce revenue and add hidden costs. Customer service labor, restocking, and return shipping can cut into margins by $10–25 per return. CLV should reflect these real-world expenses for accurate profitability insights.
Mixing Revenue with Profit in CLV Analysis
Basing CLV on revenue instead of profit inflates customer value and skews decisions. Subtract direct and variable costs, including product, shipping, and fees, to uncover the true profitability of each customer relationship.
Transform CLV Insights Into Strategic Business Advantage
Customer Lifetime Value isn’t just a metric; it’s a lens for smarter business decisions. When used consistently, CLV insights help you prioritize the right customers, optimize your spending, and align teams around what drives long-term growth. The most successful brands don’t just calculate CLV; they act on it.
Focus your efforts where they’ll make the biggest impact: boosting AOV, improving margins, lowering CAC, or increasing retention.
Small gains in each area create compounding returns that far exceed the cost of implementation. Regularly tracking CLV helps you stay proactive, adapt to changes in buyer behavior, and fine-tune your strategy over time.
FAQ


Related blogs
.avif)
Contribution Margin Calculator: Measure What Each Sale Contributes to Profit
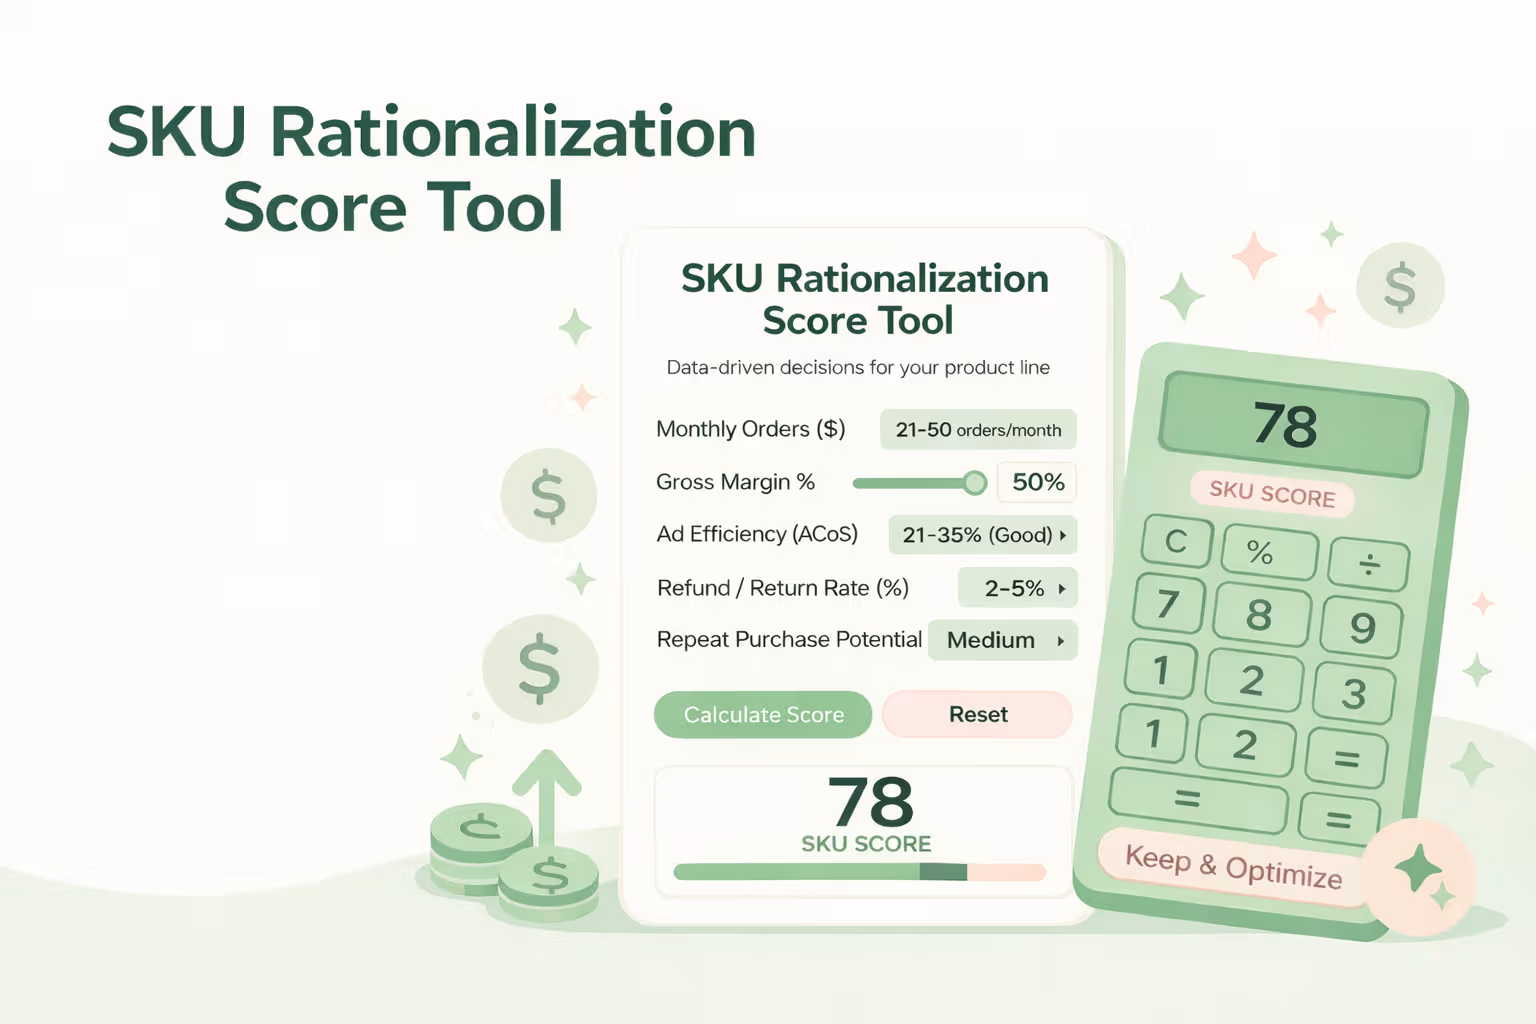
SKU Rationalization Score Tool: Cut Waste, Improve Margins, and Scale the Right Products

Price Elasticity Of Demand Calculator: Predict Revenue Impact in Seconds