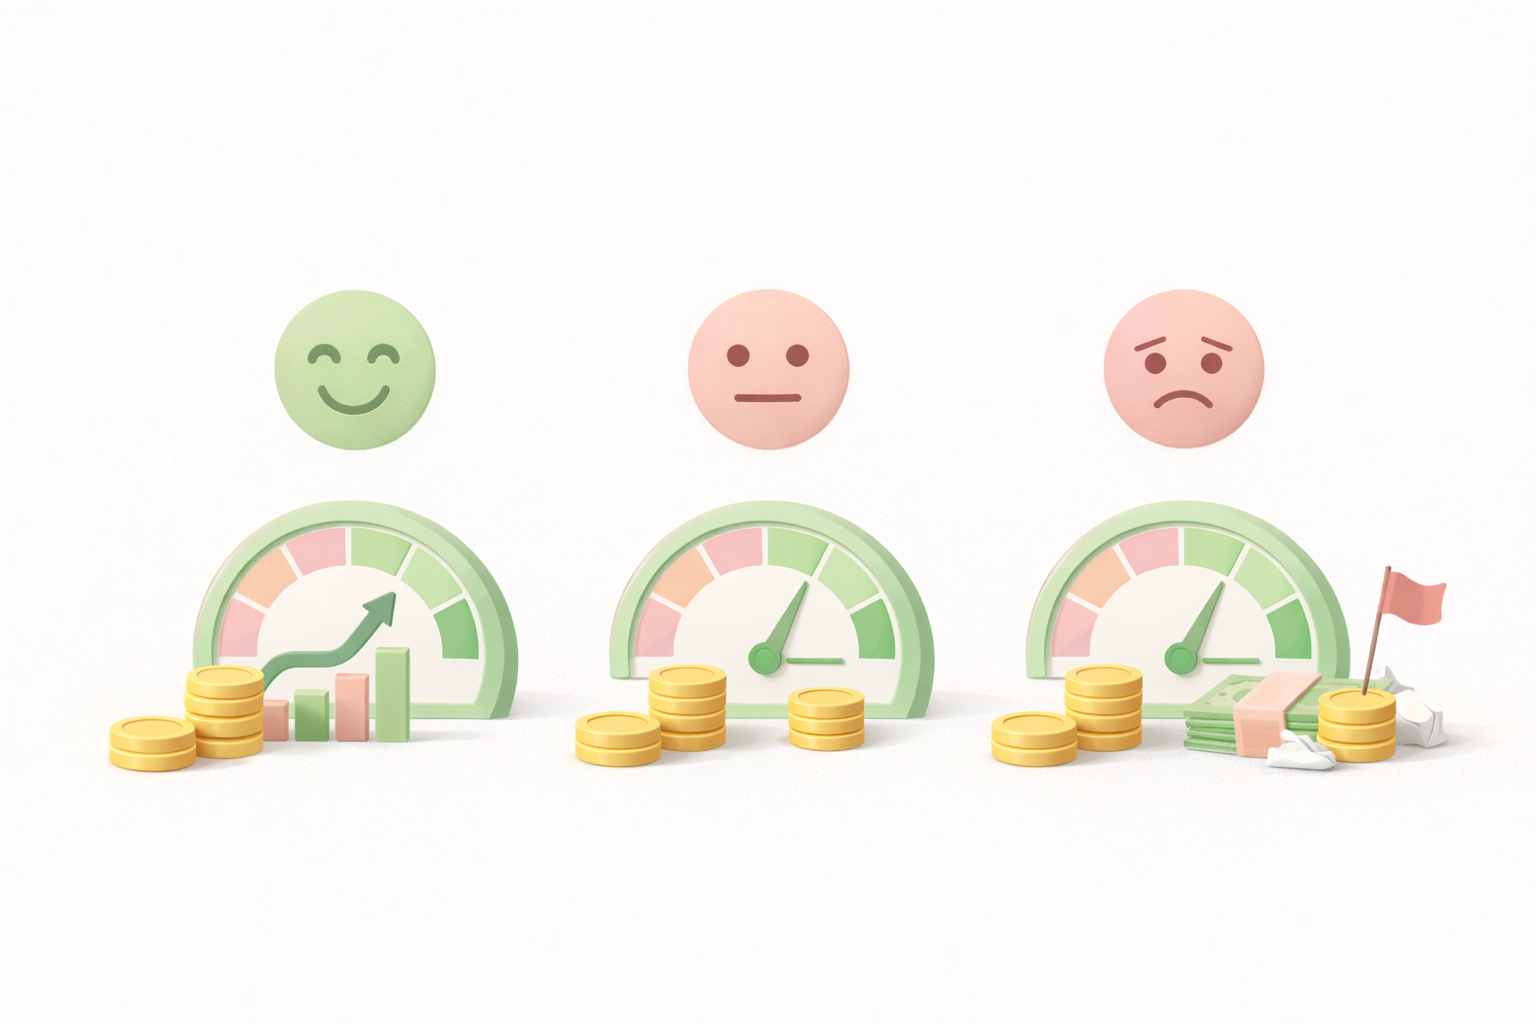
Velocity of Money Calculator: Track How Fast Your Capital Cycles Each Month
Most e-commerce operators obsess over revenue. Fewer pay attention to how fast that revenue actually moves. Run the velocity of money calculator below to find out how efficiently your cash cycles through your business each month, and where it might be getting stuck.
Enter your five inputs and get an instant read on your money velocity, days per cash turn, reinvestable cash, and effective growth velocity.
What Is Money Velocity and Why Does It Matter?
Money velocity measures how many times your available cash turns over to generate revenue in a given period. If you have $5,000 in working capital and generate $15,000 in monthly revenue, your cash is cycling, not sitting still.
Most financial reports track profit and revenue. Velocity adds the third dimension: timing. Here is what each scenario signals:
- High velocity: Cash cycles fast, margins are healthy, and reinvestment is consistent
- Low velocity: Cash moves slowly due to thin margins, long payout delays, or capital that isn't being redeployed
- Why it matters for scaling: A brand with fast-cycling cash can reinvest and restock without waiting for its own money to return
This is especially relevant if you're running a private label brand or scaling through paid traffic, where cash cycle speed directly affects how aggressively you can grow.
The Five Inputs and What They Each Do

Each field plays a specific role. Understanding what you're entering, and why, helps you use the output correctly.
Average Cash Balance
Often misread. Use only the working capital you're actively deploying for ads, restocking, and operations. Do not include reserves, savings, or payables; idle cash inflates this number and makes velocity appear lower than it is.
A simple check: if the money isn't funding a business activity this month, leave it out.
This single correction often changes a brand's velocity score significantly, making it a more accurate reflection of how efficiently the business operates.
Monthly Revenue and Gross Margin
Monthly Revenue is your gross top-line figure before any deductions. If you're running a subscription-based model, use actual monthly collected revenue, not projected MRR.
Gross Margin is the most important lever in the model. It adjusts velocity to reflect cash actually generated per cycle, not just revenue passing through. This is where private label brands hold a structural advantage:
- Typical dropshipping profit margins run between 10% and 30%
- Private label wellness and supplement brands frequently land between 35% and 55%
- The velocity gap between these two models, at identical revenue, is significant
Improving gross margin through better sourcing, product mix, or pricing is the fastest single lever for moving your velocity score. Even a 5 percentage point improvement can shift effective velocity meaningfully at scale.
Reinvestment Rate and Payout Delay
Reinvestment Rate is the portion of gross profit you put back into ads and growth each month. Only reinvested cash re-enters the cycle. Brands that reinvest 60% to 80% during their scaling phase consistently outperform those that extract cash early.
Payout Delay is the most underrated friction point in e-commerce. Consider a typical settlement timeline:
- Shopify Payments: 3 to 5 business days
- Stripe: 2 to 7 business days, depending on account settings
- PayPal: 1 to 3 business days for standard accounts
Even a 4-day gap can compress your effective velocity when running high ad spend. Tracking this is essential for anyone serious about tracking ROI accurately.
Four Metrics That Tell You Exactly Where Your Cash Is Going

The calculator produces four outputs, each measuring a different dimension of how your cash moves.
Money Velocity and Days per Cash Turn
Money Velocity is your primary number: how many times each dollar of working capital cycles through your business in 30 days.
A 3x velocity on $5,000 means you're generating $15,000 in margin-adjusted revenue per month. A 50% margin brand at 2x often outperforms a 10% margin brand at 5x.
Days per Cash Turn is the inverse: how long one full cycle takes.
A 10-day turn is lean. A 25-day turn signals drag from margin compression, slow payouts, or undeployed capital. A long turn while running paid ads means you may be funding new cycles with money that hasn't returned yet.
These two outputs work together. High velocity paired with a short cash turn confirms your operation is tight and efficient. Low velocity with a long turn means there is friction to address before scaling further.
Reinvestable Cash and Effective Velocity
Reinvestable Cash is Revenue x Gross Margin x Reinvestment Rate. It's your operational fuel figure, not your profit number, showing exactly how much is going back into growth each month.
Brands that consistently maximize this are the ones that compound their revenue instead of plateauing.
Effective Velocity is the real-world adjusted number. It factors in your payout delay and reinvestment rate to show how fast your money is truly compounding. If it drops significantly below your base velocity, payout friction, or a low reinvestment rate is the likely cause.
Use the gap between base and effective velocity as your primary diagnostic. A small gap means your operation is well-structured. A large gap means leakage is limiting how fast your business compounds.
What Your Score Tells You and How to Improve It
Different velocity ranges point to different operational realities. The goal isn't just to know your number; it's to know what to do with it.
Reading Your Score
- Above 3x per month: Healthy margins, strong reinvestment, minimal payout drag; the range where scaling ad spend makes sense
- Between 1.5x and 3x: Common for growing brands; one bottleneck is usually pulling the number down, most often gross margin or payout friction; run the calculator with adjusted inputs to isolate it
- Below 1.5x: A clear flag; slow cash in a high-ad-cost environment creates real scaling risk; pair this with the break-even ROAS calculator before committing to further spend
Practical Actions to Move the Number
- Increase gross margin by shifting to branded private label in a consumable category; reorder behavior alone restructures your margin profile
- Raise your reinvestment rate incrementally; moving from 40% to 60% shifts effective velocity meaningfully
- Negotiate payout terms with your processor, or use platforms with faster settlement windows
- Cross-reference with customer LTV; a strong customer lifetime value justifies a higher reinvestment rate because the acquisition cost pays back over multiple orders
- Track velocity monthly, not quarterly; a number you review in real time is one you can act on
High-margin consumable brands on a reliable end-to-end fulfillment partner are built for faster cash cycles with less friction. The infrastructure handles sourcing and shipping, keeping your operational cash focused on growth.
That is what sustainable scaling in e-commerce looks like. Run the numbers now, find your weakest input, fix it first, and revisit in 60 days.
Track Your Capital Like An Operator Who Compounds
Revenue is loud. Velocity is strategic. The brands that scale sustainably aren’t the ones chasing screenshots; they’re the ones measuring how fast cash returns, how much gets reinvested, and where friction is slowing the cycle.
Use the calculator. Identify your weakest input. Improve margin, tighten payout timelines, or raise reinvestment deliberately. Then run it again next month.
Compounding doesn’t happen by accident. It happens when capital moves fast, returns predictably, and gets redeployed with intent. Track it. Optimize it. Build with it.
FAQ


Related blogs
.avif)
Influencer Marketing ROI Forecaster Calculator: Know Your True ROI Before Spending a Dollar on Influencers
.avif)
What Are The Best Partners For Skin Care Brand Development?
.avif)
Brand Value Calculator: Find Out What Your Brand Is Actually Worth