Cart Abandonment Rate Calculator: Understanding and Maximizing Your E-Commerce Conversions
For online retailers, shopping cart abandonment remains one of the most telling indicators of customer intent and lost opportunity. Measuring how many shoppers start a purchase but never complete it gives businesses critical insight into user behavior and revenue potential.
This cart abandonment rate calculator simplifies this analysis by turning basic cart data into actionable insights that can drive smarter business decisions.
This article explores how the calculator works, the key elements that make it effective, and how interpreting its results can help you reduce abandonment, recover revenue, and optimize your checkout performance.
Exploring the Key Components of the Cart Abandonment Rate Calculator
The calculator helps e-commerce owners assess checkout performance by turning cart data into insights. Each component highlights where customers drop off and how much potential revenue can be recovered.
Understanding these components ensures you’re interpreting the results correctly and applying them effectively.
Carts Initiated
The Carts Initiated field represents the total number of shopping carts created by visitors. It acts as the starting point of the purchase funnel and provides context for all subsequent metrics in the calculator. Monitoring this figure helps gauge overall engagement and buying intent among your site’s visitors.
Key insights from this element include:
- Foundation for calculations: Serves as the base for determining both abandonment and conversion rates.
- Behavioral indicator: Reflects how many users show purchase intent by adding items to their cart.
- Trend analysis: Helps evaluate campaign effectiveness or seasonal variations by tracking changes in initiated carts over time.
Purchases Completed
The Purchases Completed input tracks how many of those initiated carts lead to actual sales. It’s one of the most revealing indicators of how effectively your store converts user intent into revenue.
A strong purchase completion rate generally means your checkout process is smooth and user-friendly.
This metric helps you:
- Measure conversion efficiency: By comparing completed purchases against initiated carts, you identify where users abandon the process.
- Spot UX issues: Pinpoints friction points like payment difficulties or unclear forms that discourage final purchases.
- Evaluate the success of changes: Allows you to track performance improvements after optimizing checkout flows or adding new payment options.
Average Order Value (AOV)
The Average Order Value (AOV) provides financial context to your data by estimating how much each completed purchase is worth on average. Although optional, including it allows the calculator to estimate total lost and recoverable revenue from abandoned carts.
Why this field matters:
- Revenue estimation: Converts behavioral data into financial insight by showing what’s at stake with every abandoned cart.
- Customer value perspective: Helps businesses understand spending patterns and predict future revenue trends.
- Strategic planning: Enables smarter marketing budget allocation, especially for remarketing or cart recovery campaigns.
Recovery Rate Slider
The Recovery Rate Slider helps estimate what percentage of abandoned carts you could realistically recover through remarketing efforts such as email, SMS, or retargeting ads. It introduces flexibility, allowing you to simulate outcomes under different campaign strengths.
How to interpret this feature:
- Adjustable estimation: Use the slider to set recovery expectations (e.g., 10%, 15%, 20%) based on your current or target performance.
- Performance testing: Experiment with different recovery percentages to forecast ecommerce ROI for future remarketing initiatives.
- Industry benchmarking: The default 15% serves as a standard benchmark, representing average cart recovery performance across industries.
Key Results and Metrics
After entering all inputs, the calculator provides a set of outputs that reveal both customer behavior and financial performance. These results form the backbone of your decision-making process, giving you quantifiable data to act upon.
The calculator displays the following results:
- Abandoned Carts: Total number of carts not converted into sales.
- Cart Abandonment Rate: The percentage of shoppers who started checkout but didn’t complete it.
- Conversion Rate: The share of initiated carts that successfully turned into purchases.
- Estimated Lost Revenue: The total potential income lost from incomplete transactions.
- Recoverable Revenue (Est.): The portion of lost revenue that can be regained through effective recovery campaigns.
Each metric provides actionable insight into user behavior, operational efficiency, and overall sales health, enabling businesses to transform raw data into informed strategy.

Why the Cart Abandonment Rate Calculator Is Essential for Online Stores
Every abandoned cart represents a missed revenue opportunity. This calculator quantifies that loss and identifies what portion can be recovered through data-driven action. It helps you understand why customers drop off and what improvements are worth prioritizing.
By tracking abandonment regularly, businesses can pinpoint checkout friction points, monitor improvements after UX changes, and set realistic recovery goals based on historical data. Over time, this fosters a continuous improvement cycle, where each insight leads to measurable results.
The calculator also builds trust and authority in decision-making. Instead of guessing why conversions are low, brands rely on tangible data that strengthens both strategy and accountability.

How to Interpret and Use the Calculator’s Results
Data alone isn’t powerful unless it’s understood and applied strategically. This calculator provides a foundation for evidence-based decision-making, allowing you to turn numbers into meaningful action plans.
Making Sense of the Numbers
When reviewing the results, look beyond percentages, focus on patterns and implications.
- A high abandonment rate suggests friction in the checkout process or weak purchase motivation.
- A low conversion rate may reflect unclear calls-to-action or trust concerns.
- Recoverable revenue reveals the financial impact of abandoned carts and the potential gain from improving follow-ups.
This understanding helps prioritize the most critical areas for improvement, those that will deliver the biggest return on effort.
Applying Insights Strategically
Interpreting data correctly allows for proactive decision-making. Consider how you can apply your findings:
- Benchmark your rate: Compare results with industry standards to identify performance gaps.
- Simulate recovery outcomes: Adjust the recovery slider to explore how improved campaigns could affect revenue.
- Justify marketing investment: Use lost revenue data to support budgets for automation tools or conversion-rate optimization projects.
This ensures that every action, from design updates to email campaigns, is driven by insight rather than assumption.
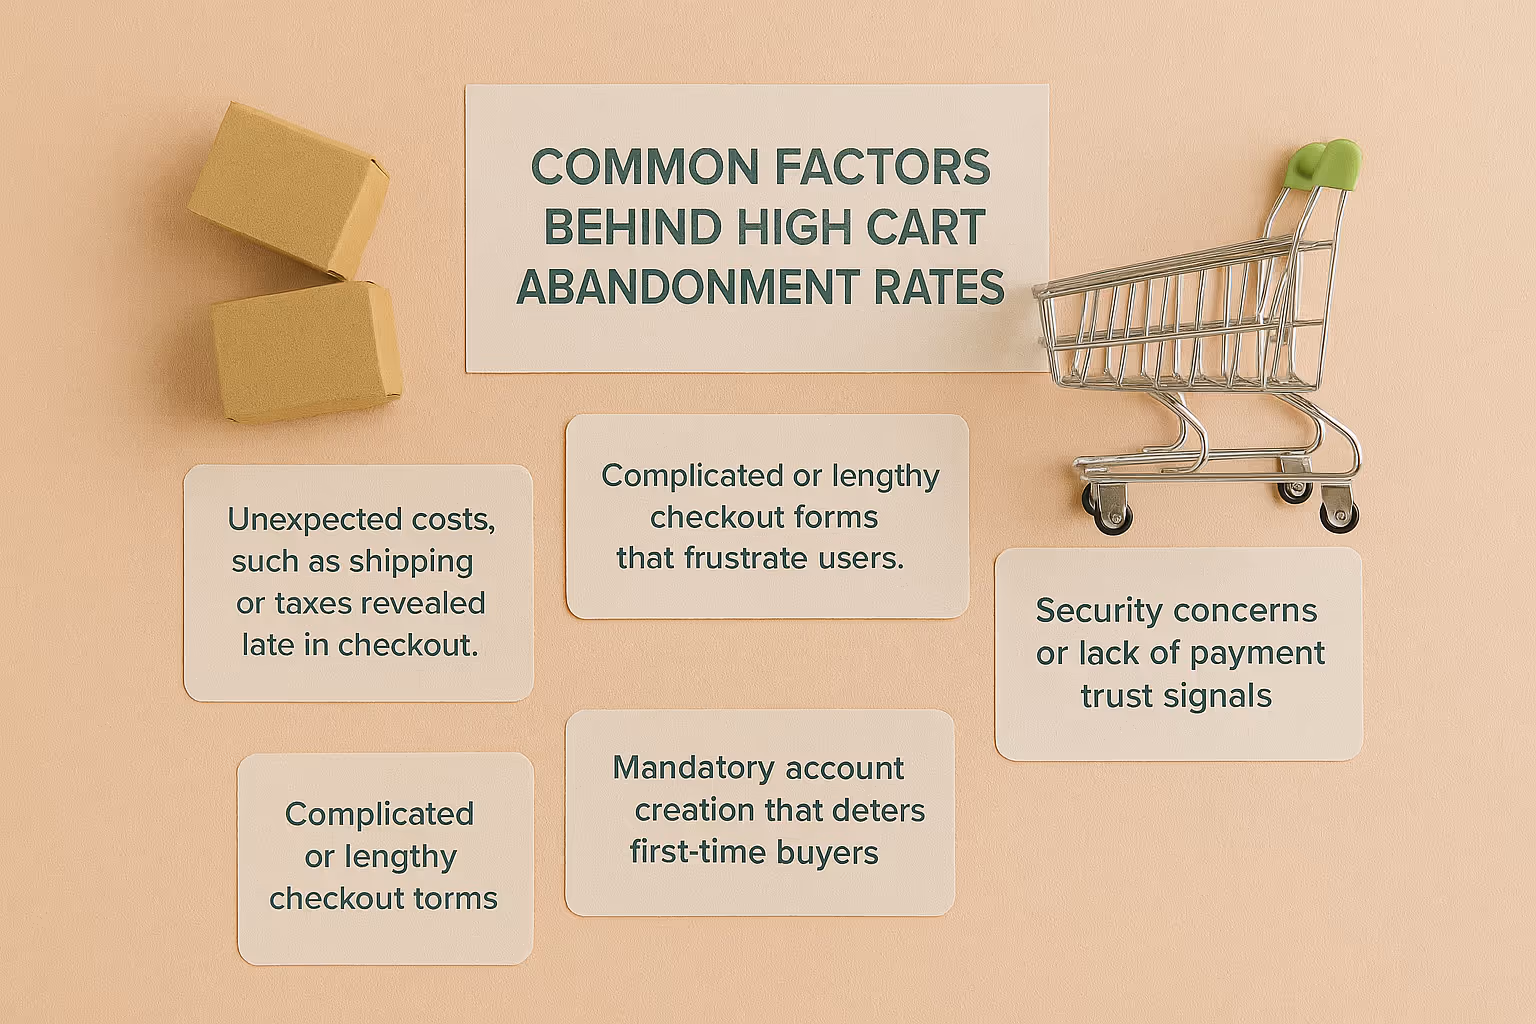
Common Factors Behind High Cart Abandonment Rates
Understanding why users abandon their carts adds context to your calculator data. Addressing these issues directly can lead to measurable reductions in abandonment rates.
The most common reasons include:
- Unexpected costs, such as shipping or taxes, are revealed late in checkout.
- Complicated or lengthy checkout forms that frustrate users.
- Mandatory account creation that deters first-time buyers.
- Security concerns or lack of payment trust signals.
- Mobile usability issues or technical errors during checkout.
Each factor contributes to friction, and tackling them systematically will help improve both user satisfaction and conversion outcomes.

Strategies to Reduce Cart Abandonment and Boost Conversions
Once calculator data reveals where issues occur, actionable strategies can close the gap between intent and purchase completion.
Simplify the Checkout Experience
Minimize barriers by keeping forms short, reducing required fields, and offering guest checkout options. Simple checkout journeys foster trust and speed, encouraging users to complete their purchase.
Be Transparent About Costs
Display shipping, taxes, and fees upfront. Unexpected charges are among the top reasons for abandonment. Transparency creates confidence and prevents mid-process drop-offs.
Offer Multiple Payment Options
Provide a variety of secure and preferred payment methods, from credit cards to digital wallets. More flexibility equals fewer lost customers due to unavailable options.
Use Cart Recovery Campaigns
Send personalized reminder emails, targeted ads, or SMS follow-ups to re-engage users. Adding incentives like free shipping or limited-time offers can significantly increase recovery rates.
Optimize for Mobile Users
Ensure your website is mobile-responsive, fast-loading, and easy to navigate. With mobile commerce continually growing, small UX improvements can have a major impact on conversion rates.
Implementing these strategies and monitoring the changes through your calculator allows for a cycle of continuous improvement and measurable growth.
Transform Abandoned Carts Into Loyal Customers
This calculator is not just a performance-measuring tool; it’s a strategic resource that guides data-backed decisions. Understanding its inputs, interpreting the results, and acting on the insights can transform how you approach checkout optimization and customer retention.
By consistently using this calculator, businesses can detect inefficiencies, measure progress, and increase recovery potential. It empowers decision-makers with clarity and confidence, helping turn lost opportunities into sustainable sales growth.
Ultimately, the calculator doesn’t just show you what’s missing; it highlights where and how you can win it back.
FAQ


Related blogs

Dynamic Pricing Calculator: Optimize Margins and Sell Smarter With Every Click
.avif)
Shopify Store Profit Calculator: A Smarter Way to Track Your Profitability
.avif)
.avif)